Debugging with PhpED and DBG
Posted in Development, php on January 20, 2008
As a long-term PhpED user, I've always been well aware that I was not making the most of some of the more powerful features of my IDE, particularly the debugging capabilities. Well this week I finally got debugging set-up properly and as per most of my other blog posts I'm listing what I did here for future reference and just in case it helps anyone else.
Step 1: Server and client communication
The dev server is our standard set-up: Debian stable (currently Etch) running with stable apt packages of PHP 5 (5.2.0) and Apache 2. I have Samba set up to share each developer's home directory with Apache, having multiple VirtualHosts per developer serving from within those home directories.
My 'client' is Windows XP or Vista (FWIW these instructions tested on both) running PhpED 5.2. We've mapped a drive to the home folder on the dev server and we can write to files within it.
The Nusphere website has detailed instructions here & here and here for getting the communication between client and server set-up. You probably want to read through all of that first but here's my summary:
Install the server module
Situated somewhere like C:Program Filesnuspherephpeddebuggerserver you should find a number of operating system specific folders, these contain the relevant dbg module, in my case I needed Linuxdbg-3.2.10-Linux-glibc-2.2.tar.gz. Unzip this and place the version specific to your PHP version into PHP's extension_dir which can be easily figured out by either running phpinfo(); or by looking at php.ini; in my case it's /usr/lib/php5/20060613+lfs. For neatness, I symlink dbg.so-5.2.x to dbg.so I then create /etc/php5/apache2/conf.d/dbg.ini and within it, I write:
extension=dbg.so
[debugger]
debugger.enabled=on

debugger.profiler_enabled=on

debugger.hosts_allow=ALL

debugger.hosts_deny=ALL

debugger.ports=7869, 10000/16
Saving and then restarting Apache, I check phpinfo(); and see near the top:
This program makes use of the Zend Scripting Language Engine:
Zend Engine v2.2.0, Copyright (c) 1998-2006 Zend Technologies
 with DBG v3.2.10, (C) 2000,2007, by Dmitri Dmitrienko
...with further down the page more detailed information relating to the dbg module.
A few notes on my set-up:
-
the
/etc/php5/apache2/conf.d/.iniis a Debian thing. If you've compiled from source or use another distribution, then it's likely that you want to put the dbg configuration settings into php.ini, you can find out where that lives on your system by looking inphpinfo() -
note the configuration line
debugger.hosts_allow=ALL. It's possible (and likely desirable) to only allow debugging sessions between specific machines. On my internal network, I don't care, so to save configuration changes when new developers start or machines change, I'm leaving it open to all.
Ensure Server can talk to client
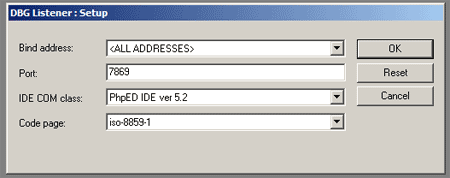
With the server successfully set-up we now want to ensure that the server can talk to the client. To do this fire up PhpED and ensure that the the listener is running, this is the little satellite dish in your task bar. If you right-click and select set-up you should see this:

Good, now on the server telnet to the client, thus:
telnet 7869
If it's working you should see a black dot appear within the listener icon in the system tray, if so you're done. Just Ctrl and ] to exit the telnet session and move onto step 2.
Note: If you don't know your ip address you can fire up a dos window and type ipconfig.
Step 2: Project set-up and mappings
Step 1 is all relatively straightforward assuming you're already comfortable with the inner workings of your set-up. What is less obvious is how to properly set-up the project to actually get down and start debugging. I have had partial success in the past with simple projects but the issue has always been with mappings. If all you want is a PhpED project where it's root is also the document root of the website then there's not a lot to it. Where the problem lies, for me at least, is when there are library files outside of the document root that you still want to be able to see and edit from within your project.
To illustrate a slightly more complex project set-up I'll go through the mappings for one of my Symfony projects.
My directory structure is as follows:
#(checked out from subversion, this is the trunk)
/home//www/projectname
/home//www/projectname/codebase
# (default name for a Symfony project's document root)
/home//www/projectname/codebase/web
where /home// is mapped to Z: (or whatever) on the client.
Elsewhere Symfony has been installed using PEAR so lives in /usr/share/php/symfony. To make it easier for a developer to look at (read only) versions of core Symfony (and PEAR) classes I ensure that within the developers' sandbox the library files are symlinked. So for example with symfony the developer would have:
/home//www/lib/symfony -> /usr/share/php/symfony
We want to be able to edit all of the files within the project so when setting up the new project we set the root directory to be the projectname folder so in this case it'll be Z:wwwprojectname and for now, just to get the project set-up and the code imported set the 'Run mode' to be Local CGI.
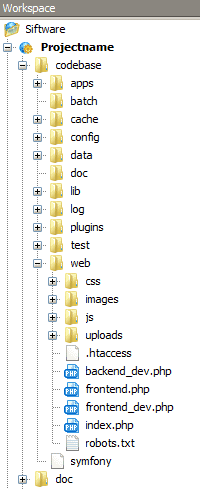
Doing so gives us this view within the workspace:

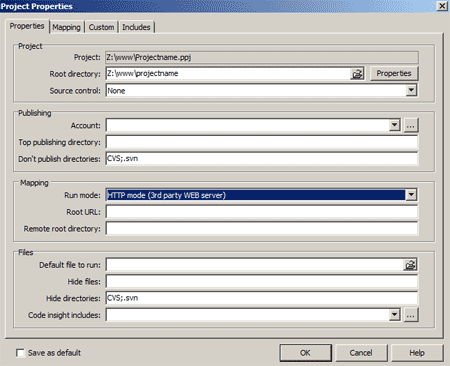
That done we need to get the mappings sorted, so entering project properties again we set things up so they look like this:

Namely:
-
Root directory is unchanged and
Z:wwwprojectname -
Run mode is 3rd party web server
-
Root URL is blank
-
Remote root directory is blank
If we were to press the OK button now PhpED would complain as it needs to know which URL you're using to access the third party web server (our dev server) so instead we select the Mapping tab and add the following mappings
-
The apache document root
-
Local directory is
Z:wwwprojectnamecodebaseweb -
Remote directory is
/home/user/www/projectname/codebase/web -
URL is
http://projectname
-
-
The Symfony libraries
-
Local directory is
Z:wwwlibsymfony -
remote directory is
/usr/share/php/symfony
-

Ensuring that the original project root (in bold) is at the bottom of the list we can now press OK.
That's it. If we open one of our pages, in Symfony's case one of the files under web, and then press the debug button (green arrow with a D in) or press F5 the debugging session with launch and by default it'll stop on the first line of the first file. You're now in debug mode, alright!.
How to use the debugger is left as an exercise for the reader. As you'd expect there's more information on PhpED's debugging features on their website.